In the past, running Facebook advertising was almost “easy as pie”; you just needed to create a few ad creatives, put them into different ad sets, each targeting a detailed interest, and you could see clear results.
But now, everything has completely changed. Running Facebook ads is no longer a game of chance but demands deep strategic analysis and skill. And as advertising costs continue to escalate, mastering and understanding advertising metrics is crucial—it doesn’t just help you know which campaigns are performing well, but also helps you professionally explain the results to your clients or your team. In this article, Optimal Agency will explore the most critical metrics in Facebook advertising, the numbers you see in Ads Manager, whose significance not everyone truly understands.
Advertising metrics on Facebook to pay attention to
When running Facebook ads, focusing only on creative content or selecting the target audience is not enough. To truly optimize performance and ensure the budget is spent wisely, advertisers must regularly monitor and analyze key advertising metrics. These numbers don’t just show how your campaign is performing; they also help identify strengths, weaknesses, and opportunities for improvement at every stage. Below are the pivotal Facebook Ads metrics that advertisers need to pay close attention to.
Conversions
Before starting any ad campaign, it’s vital to define the specific business objective you aim to achieve. The goal could be to increase website traffic, boost sales, attract newsletter sign-ups, or encourage app downloads. Results (also known as Conversions ) are the total number of times your ad achieves the set objective. For example:
- If you want to increase sales, each time a user completes a purchase is counted as a conversion.
- If you focus on a lead generation campaign, each successfully submitted form is considered a result.
Tracking this metric helps advertisers understand the real value the ad brings. It forms the basis for assessing performance and determining whether the advertising cost is generating proportional revenue. Moreover, conversion analysis helps detect potential issues in the customer journey.
For example, if your campaign receives many clicks but few orders, the problem may lie with the user experience on the website or the landing page content not being persuasive enough.
Conversely, if there are many impressions but few clicks, it indicates that your ad is not engaging enough or is irrelevant to the target audience segment.
Conversion Rate
After understanding the total number of results, the next metric that advertisers need to focus on is the Conversion Rate (CR). This is a measure of the effectiveness of the landing page and the ad message, showing how many people who clicked on the ad actually completed the desired action. The formula for the Conversion Rate is:
Conversion Rate = (Number of conversions / Total visits from ads) × 100%
For example, if 1,000 people click your ad and 50 make a purchase, your Conversion Rate is 5%.
It helps assess the effectiveness of the message, the landing page, and the customer journey. A low Conversion Rate may be due to a slow-loading landing page, an unoptimized design, or an unclear Call-to-Action (CTA). To improve this rate, advertisers should frequently perform A/B Testing to identify the ad and landing page versions that yield the best results.
ROAS
ROAS (Return on Ad Spend) is one of the most critical metrics for measuring the profitability of a Facebook ad campaign. This metric indicates the amount of money you earn for every dollar spent on advertising. The formula for ROAS is:
ROAS = Revenue / Advertising cost
For example, if you invest $2,000 in a campaign and generate $5,000 in revenue, your ROAS is 2.5—meaning for every $1 spent, you earn $2.5 back. ROAS helps evaluate the profitability of each campaign, allowing you to allocate your budget more effectively.
- For e-commerce stores, ROAS is the core metric reflecting direct sales performance.
- For lead generation campaigns, you should focus on Cost Per Lead (CPL) and the number of leads acquired.
For example, if an online fashion store spends 10 million VND on Facebook ads and generates 30 million VND in revenue, their ROAS is 3.0, showing the campaign is generating significant profit.
Amount Spent
Amount Spent is the total cost that advertisers have invested in an ad campaign over a specific time period. This number may seem simple, but it carries significant meaning for budget management and assessing return on investment (ROI).
For example, if you run an ad campaign for 7 days with a daily budget of 5 million VND, the “Amount Spent” after the campaign ends will be 35 million VND.
However, this number is not just for recording costs. We advise advertisers to combine it with other metrics like ROAS, CPC, or CPM to evaluate how profitable that budget is and whether it is effective. For example, spending 10 million VND but generating 50 million VND in revenue shows your campaign is delivering a 5x return. Conversely, high spending with low revenue is a signal to re-evaluate the target audience, ad creative, or landing page.
Cost Per Click
In any ad campaign, CPC (Cost Per Click) is one of the most important metrics for measuring the effectiveness of the content and the appeal of the ad. Simply put, CPC represents the average amount you have to spend to get one click on your ad. The formula for CPC is:
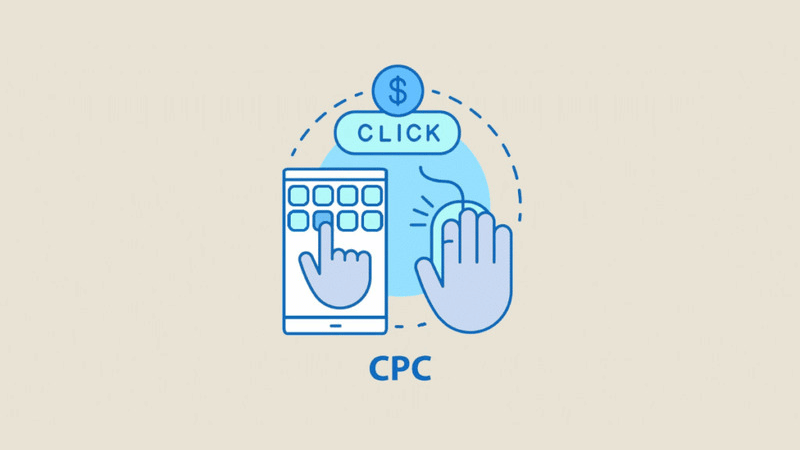
CPC = Total Advertising Cost / Total Clicks
For example, if you spend $1,000 and receive 500 clicks, your CPC will be $2/click.
On average, CPC on Facebook typically fluctuates around $1.7, depending on the industry, audience, and country. For example:
- In the fashion industry, CPC is often around $0.7 – $1.2.
- In the finance or real estate sectors, CPC can be higher, from $3 – $5, due to greater competition.
CPC helps you understand the actual cost of attracting users to interact with the ad. A very high CPC may indicate that your ad is not engaging or the target audience is too narrow, leading to high competition. Conversely, a low CPC with high conversions is a sign that your ad content is relevant and effective.
Cost Per Mille
Another metric that advertisers should not overlook is CPM (Cost Per Mille), as this data indicates the amount you pay for your ad to be displayed 1,000 times. Unlike CPC (which focuses on the click action), CPM reflects the ad’s display rate and reach. The formula for CPM is:
CPM = (Total Advertising Cost / Total Impressions) × 1,000
For example, if you spend $870 for 100,000 impressions, your CPM will be $8.7, which aligns with the average CPM on Facebook in January 2024.
CPM reveals the level of competition in the market segment you are targeting. When CPM increases, it usually means more advertisers are targeting the same audience or the ad’s relevance has decreased. Conversely, a low CPM indicates your ad is performing efficiently, reaching many people at a reasonable cost. Tips for effectively lowering CPM:
- Expand the audience segment: When your audience is too narrow, Facebook has to “bid” higher to display the ad, leading to increased CPM. Try expanding the target group based on similar interests or behaviors.
- Optimize ad relevance: Facebook evaluates ads based on their suitability for the viewer (previously called “Relevance Score,” now Ad Relevance Diagnostics). The more relevant the ad, the more Facebook prioritizes its display at a lower cost.
- Improve user experience: If viewers interact positively (watch the video longer, click the link, leave positive comments), the system will automatically prioritize your ad.
Detailed ad analysis guide for those who want to scale campaigns
When starting to scale a Facebook ad campaign, many advertisers only look at superficial metrics like ROAS, number of purchases, or average cost. However, to truly scale the budget Facebook ads while maintaining effective profitability, we advise you to learn how to perform in-depth data analysis to understand what is genuinely driving performance.
Pay attention to both Reach and Frequency
Many people new to advertising often assess effectiveness based on Reach, but in reality, this metric does not reflect action or conversion quality. What advertisers care about more is Frequency. Frequency helps you understand whether the ad is reaching new people or just repeating to the same audience.
For example, over the past 7 days, if the average ad frequency is only around 1.0 – 1.2, it shows your ad is still reaching new audiences.
Conversely, when the Frequency increases to 2.0 or higher, it means viewers are starting to see the ad repeated multiple times—at this point, you should create new creative content (new creative) to reach other potential customer groups. This doesn’t mean your ad has “creative fatigue,” but sometimes it’s simply a creative limitation—meaning the same message has been fully distributed within the relevant audience range.
Avoid over-focusing on CPM, CPC, CTR
A common mistake we often see is advertisers overly focusing on CPM, CPC, or CTR, while these metrics do not reflect actual business results.
- CPM can vary by industry, time, and audience. A high CPM is not always bad. In many cases, a high CPM indicates you are targeting a high-quality, higher-spending customer group.
- For example, a campaign targeting business professionals in Ho Chi Minh City often has a CPM double that of the student audience, but the conversion rate and average order value are much higher.
- CPC (Cost Per Click) and CTR (Click-Through Rate) also need to be viewed cautiously. A high CTR is not necessarily good, as an ad with a “clickbait” image or headline might attract clicks but fail to bring in actual customers.
- For example, you can increase CTR by using attractive visuals or curiosity factors, but after users click, they leave the page immediately because the product is irrelevant.
Therefore, we are only truly concerned with CPA (Cost Per Acquisition/Action). When we see a low and stable CPA, we then look back at secondary metrics like CTR, CPM, or Scroll Stop to understand why that ad is performing better than others.
The secret to evaluating creative appeal lies in Scroll Stop and Hold Rate
If CPA tells you whether the ad brings in customers, then Scroll Stop and Hold Rate indicate whether the ad truly engages viewers. These two metrics are especially important for video campaigns or visually heavy content.
- Scroll Stop: is the percentage of users who stop scrolling when your ad appears in their feed. For example, if you have 10,000 impressions and 2,200 people stop to watch for at least 3 seconds, your Scroll Stop is 22%. When this metric exceeds 20–25%, we know the ad is grabbing attention and is compelling enough to make users pause.
- Hold Rate: is the percentage of viewers who watch the ad video from start to finish. For example, if 1,000 people start watching the video and 400 people finish it, your Hold Rate is 40%—a very good number in the e-commerce industry.
When we find an ad with a high Scroll Stop and a low CPA, we deeply analyze factors such as the hook, thumbnail image, video editing pace, storytelling, and CTA to extract the “golden formula” for subsequent ads.
How to create Custom Metrics for deeper analysis
To accurately track Scroll Stop and Hold Rate, you can create Custom Metrics right in the Meta Ads Manager. The formulas are as follows:
- Scroll Stop (%) = (3-Second Views / Impressions) × 100
- Hold Rate (%) = (Full Video Views / Impressions) × 100
These two metrics help advertisers evaluate audience retention capability and the true creative quality of each ad.
For example, if ad A has a Scroll Stop of 25% and a Hold Rate of 40%, while ad B only achieves 10% and 15%, ad A is clearly engaging viewers more than twice as effectively.
Monitoring and understanding advertising metrics on Facebook is the key for advertisers to optimize campaigns and increase profit. When you know how to correctly interpret metrics like CPC, CPM, CPA, or ROAS, you don’t just see the surface-level results; you can accurately assess the ad’s true performance. Treat data as your compass—the more you understand the numbers, the easier it is to guide your campaigns to success.
Frequently Asked Questions
In Meta Ads Manager, you can view detailed information on the performance of every ad run on Facebook and Instagram. This data includes: the number of people who saw the ad (Reach/Impressions), the number of people who clicked the ad (Clicks), and the advertising cost. Additionally, you can view metrics related to the Performance, Demographics, Platform, or Delivery of the selected campaign, ad set, or ad.
If you want a high Conversion Rate, the ad campaign needs to be designed to be relevant to the target customer to prompt action. You can apply the following methods:
Define a clear conversion goal and focus on achieving it.
Ensure that the landing page that the ad directs to has engaging, readable, and easy-to-understand content. The landing page needs to be optimized and provide the information and solutions customers are looking for.
Use advertising tools like A/B testing to test and optimize different elements of the ad.
Implement remarketing campaigns to reach customers who have previously visited the brand’s website and increase the conversion rate.