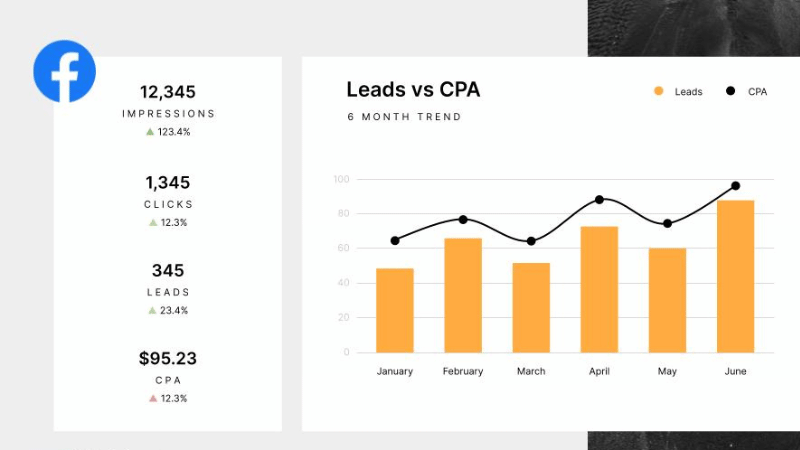
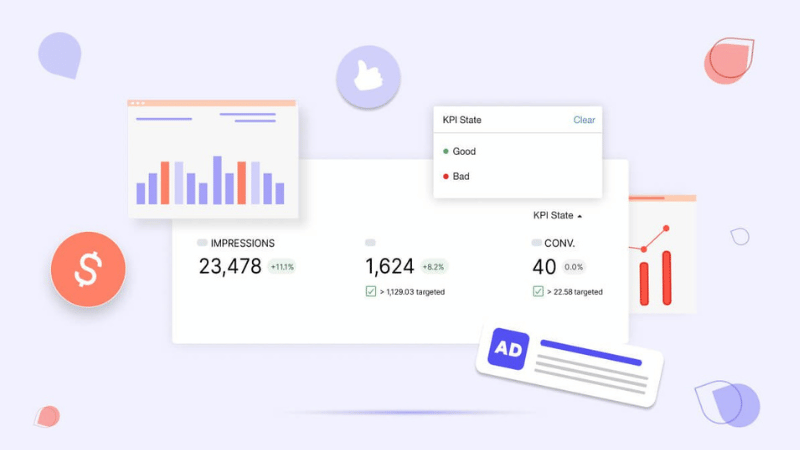
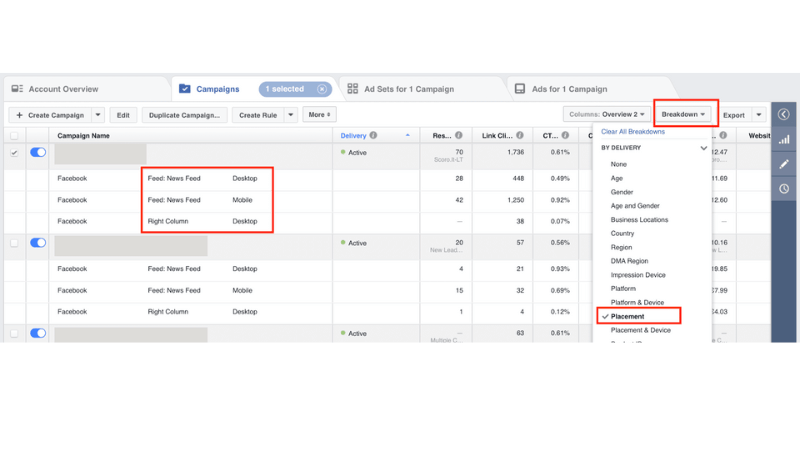
When running ads, the biggest headache for marketers is not the lack of ideas, but not understanding why the budget is being spent without an increase in performance. That’s when the Facebook Ads reporting tool unleashes its true power. This tool helps you look deeply into every metric, from click-through rate (CTR) to cost per conversion, to know exactly what is working and what is causing the budget to be wasted. Using the Facebook Ads reporting tool correctly is like navigating your campaign map – it helps you discover strengths, weaknesses, and make timely adjustments before it’s too late. The article below will show you how to leverage data to make smarter decisions, optimize performance better, and transform reports into a strategic tool, not just a lifeless spreadsheet.
Facebook Ads report – The data tool that drives growth
A Facebook Ads report is not merely a summary of advertising metrics; it is the foundation for a business to clearly understand user behavior, determine the campaign’s direction, and optimize costs effectively. Every number in the report reflects the quality of the marketing strategy, from the ability to reach to the actual conversion rate. Many businesses achieve breakthrough growth simply because they read and analyze the data correctly.

What is a Facebook Ads report?
A Facebook Ads report is a system that aggregates performance metrics, including impressions, clicks, average cost, conversion rate, and revenue generated. This tool enables marketers to track details of each campaign, ad set, and target audience. From there, they can quickly identify problems such as a scattered budget, unengaging content, or an inaccurate customer file. Using the report not only helps you know which campaign is effective but also points out why it is effective.
The importance of reporting

The data in the report is the basis for decision-making. Instead of relying on gut feeling, marketers can use real metrics to adjust strategy and predict user behavior trends. By clearly seeing the Cost per Result and Return on Ad Spend (ROAS), businesses can reallocate the budget to the ad sets with the highest profitability. Additionally, the report helps detect abnormal fluctuations early, such as a sudden drop in engagement or an unusually low click-through rate, allowing for timely intervention before revenue is affected.
Connecting customer retention and proving business credibility
Beyond revenue goals, the Facebook Ads report also helps businesses build sustainable relationships with customers. By tracking behavioral data, you gain a better understanding of the loyal customer segment, which content prompts positive responses, and when they interact the most. Maintaining the appropriate ad frequency helps the brand retain visibility without annoying viewers. Simultaneously, the ability to conduct deep data analysis is also a factor that demonstrates the professionalism and credibility of the business in the eyes of partners, investors, and customers.
Properly utilizing the Facebook Ads report is not just about making marketing more accurate; it is a way to build a solid, data-driven business system aimed at true growth.
Key metrics marketers need to track
In an increasingly competitive advertising world, decision-making cannot be based on intuition. Marketers need to accurately understand and track every metric to optimize campaign effectiveness. This involves not only reading the metrics but also analyzing them within a practical context: user behavior, business goals, and the brand’s stage of development. Below are the core metric groups that any Facebook advertising campaign needs to monitor continuously.

Core metrics
These basic metrics reflect the overall health of the campaign. They allow marketers to identify early signs of instability and make timely adjustments.
CTR (Click-Through Rate): This metric reflects the ad’s appeal to viewers. A high CTR shows that the content, visuals, or call-to-action are compelling enough to attract the right target audience. The ideal level is generally 2% or higher, indicating strong interaction between the ad and the user. When the CTR is below 1%, it is a clear signal that you need to refresh your creative or test a different format.
CPC (Cost Per Click): This is the average cost for each click. A professional marketer should not just record the number but understand its context. A high CPC can be acceptable if the conversion rate is good or if the ad is targeting a high-value audience. Comparing your CPC to the industry benchmark and previous periods will help determine whether the campaign is on the right track.
Conversion Rate: In 2025, the average conversion rate on Facebook Ads is around 9.2%, but each industry has its own standard. High-value products or complex purchase processes often have lower rates. Always compare your conversion rate with industry data rather than just looking at the average number for a more accurate assessment.
Key ROI metrics for the client
After assessing the basic operational metrics, the next step is to examine financial performance. This is the group of metrics that directly reflects profitability and the campaign’s scalability.
ROAS (Return On Ad Spend): The optimal ROAS typically ranges between 2–4x, meaning that for every dollar spent, the revenue generated can be 4–5 times higher. However, each business model has a different sustainable threshold. Some industries with high operating costs need ROAS to reach 6x to ensure profit. Therefore, defining the ROAS target must be based on the specific profit structure and product lifecycle.
CPA (Cost Per Acquisition): CPA needs to be understood in correlation with the profit margin. For example, if the average order value is $100 and the profit margin is 30%, a CPA of $25 still ensures good profit. A low CPA is not always ideal if it leads to a decrease in customer quality. Set the CPA within the context of your unit economics to determine the most reasonable spending level.
CLV (Customer Lifetime Value): CLV represents the value a customer brings throughout their relationship with the brand. Tracking CLV helps evaluate the quality of customers acquired from Facebook Ads. Modern Facebook Ads reporting tools with AI analysis strongly support linking ad performance to long-term business value, helping marketers adjust spending strategies more reasonably.
Statistical data for reporting
Besides financial metrics, presenting data clearly helps clients see the campaign’s overall impact. These numbers serve not only to evaluate performance but also to support future strategic planning.
Reach and Frequency: These two metrics show the number of people who saw the ad and the frequency of its display. When the frequency exceeds 3x while performance drops, it is a sign of creative fatigue. This requires changing the creative or expanding the audience pool to maintain effectiveness.
Engagement Rate: Actions such as likes, comments, shares, or saving the post demonstrate the audience’s reception of the content. A high engagement rate proves the ad touches upon users’ needs or emotions, thereby creating a foundation for conversion in a later stage.
Brand Awareness Improvement: For campaigns focused on awareness, metrics such as the growth in brand searches or the number of social media mentions are extremely important. This data helps determine that the ad not only brings clicks but also creates a real impact on the brand image in the minds of users.
Creating Facebook ad reports on Ads Manager: The most detailed step-by-step guide
The Facebook Ads reporting tool is an essential platform that helps marketers track campaign performance, analyze costs, and measure conversions. By understanding how to utilize it correctly, you can grasp the user journey, optimize ads based on real data, and make more accurate decisions.

Facebook Ads Manager
Facebook Ads Manager is considered the control center for all advertising activities. This Facebook Ads reporting tool allows you to create, edit, and monitor the effectiveness of each ad group within the same interface. The biggest advantage is the ability to display detailed data, a fast processing speed, and it is completely free. However, the weakness lies in its complex interface, difficulty for new users, and lack of aesthetic appeal when sending reports to clients. Many professional marketers often have to filter the data, export files, and then manually compile them for a cleaner presentation.
Basic report template
To begin, access Ads Manager and select the Reports section. In the interface, select Create new report to initialize the data. The next step is to choose the ad account to report on, then select the appropriate display layout, such as a Pivot table, Trend line chart, or Bar chart. Once completed, click Continue to enter the customization section.
Here, you can choose to add metrics such as cost, impressions, click-through rate, or conversion rate. The data can be rearranged by columns or filtered by time for easy monitoring. After refining, save the report for quick access in subsequent times. This is the basic report format, sufficient for campaigns currently in the testing phase or for clients who only need an overview of the results.
Advanced report template with custom data
When deeper analysis is required, marketers can create an advanced report in the Ad Reports section. Open an existing report or create a new one, then select Customize Pivot Table and access the Metrics section. Select + Create to add custom formulas, which can involve addition, subtraction, multiplication, or division between existing metrics to create specialized indicators like Cost per Order or Average Profit per Customer.
Next, choose the display format, which can be a number, percentage, or currency. Finally, set the access level for the working group before clicking Create. This method helps you build a flexible reporting system that accurately reflects the actual performance of each campaign and significantly saves time when evaluating communication effectiveness.
Facebook Ad Management services at Optimal are designed for businesses to run more effective campaigns with optimized budgets and accurate customer files. Optimal’s team of experts optimizes every phase of ad delivery, from customer Insight analysis, target audience selection, creative design to performance measurement and transparent reporting. By working with Optimal, you save time and resources, avoid the risk of account locking, run ads with high stability, and achieve sustainable sales growth.
Frequently Asked Questions
The discrepancy often stems from three factors: the attribution window, the event measurement method, and the data synchronization time. Facebook often attributes results within 7 days after the user clicks the ad, while the Pixel may record in real-time. Additionally, if the event has not been triggered enough times or is blocked by a cookie blocker, the reported data will be skewed. The solution is to set a consistent attribution window and use the Aggregated Event Measurement tool for accurate synchronization.
In Facebook Ads Manager, you can go to the Ad Reports section, select Schedule Report Delivery, and set the time, file format (Excel or CSV), as well as the list of recipient emails. The system will automatically send the data according to the predefined schedule, helping to save time on manual compilation.