Facebook ads reports PPC are the “map” that helps marketers clearly see the path of budget spending, the effectiveness of each campaign, and customer behavior. Going beyond mere dry numbers, Facebook ads reports PPC also provide a strategic perspective, allowing a business to turn data into a competitive advantage. When you know how to read and utilize the reports, you can make accurate decisions, cut waste, and maximize the profit from every dollar invested in advertising. This is the stepping stone to turning Facebook advertising from a simple reach tool into a sustainable growth driver.
So, is it difficult to read and understand Facebook ads reports, PPC? This article will guide you to understand Facebook ads, PPC, and how to monitor ad performance on Facebook.
A true understanding of Facebook ads PPC
When mentioning Facebook ads PPC, many people often simply think of paying for ads to be displayed. In reality, PPC (Pay Per Click) is not just a payment model, but also a crucial marketing strategy that helps a business proactively control its budget, measure effectiveness, and optimize results. To exploit the maximum potential from PPC, a business needs to clearly understand the concept, importance, and how to monitor the metrics during the ad run.
What is PPC?
PPC (Pay Per Click) is an advertising model where a business only pays when a user actually clicks on the ad. This means the budget is not wasted on impressions that do not bring interaction. On Facebook, PPC is implemented through an auction system, where your ads compete on bid price, relevance, and content quality to be displayed in front of the right target audience.
With the characteristic of “pay per click,” PPC helps a business control its cash flow more transparently than many other forms of advertising. Not only does it increase traffic, but PPC on Facebook also offers the ability to precisely target by age, gender, interests, behavior, etc., helping the campaign reach the right potential customers. More importantly, data from PPC is the basis for a business to evaluate the Return on Investment (ROI), from which it can have an appropriate adjustment strategy.
Grasping ad costs
One of the biggest advantages of PPC is that a business knows exactly how much it is spending and for what result. Metrics like CPM (Cost Per 1,000 Impressions) and CPC (Cost Per Click) help the marketer clearly understand the budget’s performance. For example, if CPC is unusually high, it could be a sign that the content is not engaging enough or the targeting is not precise. Regularly monitoring costs not only avoids waste but also optimizes every dollar spent.
Measuring campaign effectiveness
In addition to cost, effectiveness metrics such as CTR (Click-Through Rate), Conversion Rate (CVR), or ROAS (Return On Ad Spend) directly reflect the success level of the campaign. A high CTR shows that the ad is attractive enough, while the Conversion Rate helps evaluate the persuasiveness of the content toward the desired action, such as purchasing, signing up, or leaving information. A comprehensive PPC report will help a business see a clearer picture instead of relying on intuition alone.
Making data-driven decisions
The greatest strength of PPC is its ability to provide specific data. From the numbers in the report, a business can compare ad groups, analyze customer behavior, and identify trends. Instead of guessing, every decision, such as which ad group to increase the budget for, changing the content, or testing new audiences, is based on numerical evidence. This not only saves time but also enhances business effectiveness sustainably.
The elements that make up PPC
When mentioning PPC (Pay Per Click), many people often simply think of it as a form of pay-per-click advertising. However, for successful Facebook ads reports PPC, you need to clearly understand the core constituent elements. Each element not only affects the cost but also determines the effectiveness and competitiveness of the ad. Below are the important components you cannot overlook when implementing PPC.

- Keywords are the foundation of every Facebook ads report PPC. Choosing the right keywords will help the ad be displayed in front of the correct potential customers. You need to classify keywords by search intent, for example: transactional keywords (buy now, cheap price, sign up), informational keywords (guide, how to use, review)… In addition, using negative keywords is also important to eliminate irrelevant clicks, avoiding budget waste. A PPC campaign is only truly effective when you know how to optimize the keyword list intelligently.
- Ad Copy: Ad Copy is the “face” that directly reaches users. An appealing ad creative needs a clear headline, concise description, and a strong Call-to-Action (CTA). The ad content must match the keywords while creating a sense of urgency or providing a distinct value compared to the competition. Furthermore, A/B testing multiple ad versions will help you find the ad copy with the highest Click-Through Rate (CTR).
- Landing Page: The Landing Page is where users are directed to after clicking the ad. If the ad promises one thing but the landing page does not meet the need, the customer will leave immediately. An effective landing page needs consistent content with the ad, fast loading speed, a user-friendly interface, and especially a prominent CTA. Investing in optimizing the user experience on the landing page not only helps increase the conversion rate but also improves the overall Quality Score of the campaign.
- Quality Score: The Quality Score is a measure that Google or Facebook uses to evaluate the relevance between the keyword, ad, and landing page. The higher this score, the lower the Cost Per Click will be. This means you compete not only on bid price but also on content quality. Continuously optimizing keywords, writing more engaging ads, and improving the experience on the landing page is the best way to enhance the Quality Score.
- Bidding: Bidding decides how much you are willing to pay for each click. In PPC, there are many bidding strategies, such as manual, automated, or goal-based (target CPA, target ROAS). Depending on your business goals, you need to choose the appropriate pricing method to ensure both visibility and cost optimization. More importantly, the bid should not be seen as a “who pays more wins” race, but must be harmonized with the Quality Score to achieve the highest effectiveness.
- Budget: The Budget is the limit you set for the PPC ad campaign. Reasonably allocating the budget will help you avoid “running out of money” while still ensuring effectiveness. You can start with a small budget for testing, then gradually adjust based on the data collected. In addition, you need to pay attention to daily spending to promptly reallocate the budget to ad groups or keywords that bring a high conversion rate.
Reading Facebook ads reports PPC like a pro
To effectively manage the ad budget on Facebook, monitoring PPC (Pay Per Click) performance is an indispensable factor. Facebook ads reports PPC not only tell you how much money you have spent, but also show whether the ad is truly effective in attracting customers. Here is a detailed step-by-step guide on how to access, customize, and analyze ad reports on Facebook.
Step 1: Access Facebook Ads Manager
First, you need to log in to Facebook Ads Manager. This is where all the data about your campaigns, ad groups, and ads is concentrated. On the main interface, you can see an overview of the metrics, but to monitor in more detail, you will need to customize and deeply analyze each report. Ads Manager is the “control center” for you to monitor the entire PPC ad performance.
Step 2: Customize the report columns
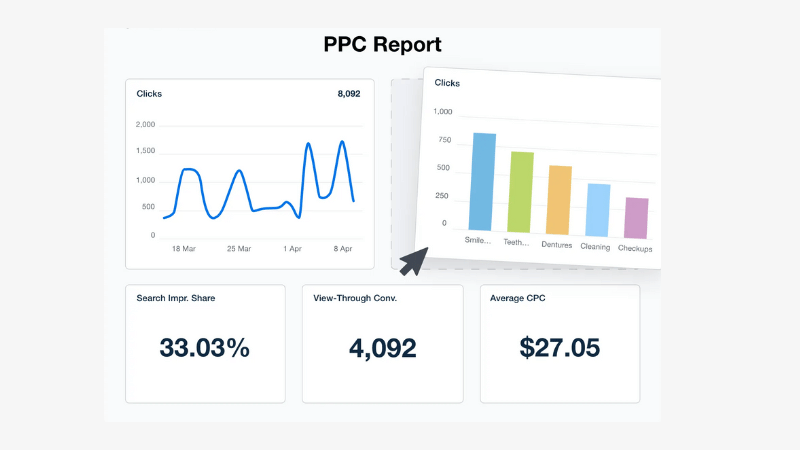
To clearly see the PPC metrics, you need to adjust how the data is displayed in the report. In the Ads Manager interface, find the “Columns” or “Customize Columns” menu. Customizing the columns helps you not get “overwhelmed” by hundreds of metrics, but instead focus only on the numbers that correctly reflect the PPC effectiveness. Here, you can select the most important metrics for your PPC campaign. The metrics you should enable in the report include:
- Clicks: The total number of clicks on the ad.
- Link Clicks: The number of clicks directly on the link in the ad – more important than general “Clicks.”
- CPC (Cost Per Click): The average cost for each click.
- CTR (Click-Through Rate): The click rate compared to the number of impressions.
- Impressions: The number of times the ad appeared on users’ screens.
- Reach: The number of unique people who actually saw the ad.
- Spend: The total amount of money spent on the campaign.
- Conversions: The number of desired actions (purchases, form fills, sign-ups…).
- CPA (Cost Per Action): The average cost for each conversion.
Step 3: Analyze eky PPC metrics
Once you have a customized report, the next step is to analyze the data. This is the crucial stage that helps you evaluate effectiveness and optimize the campaign.
Evaluate ad quality
- CTR: A high CTR proves that the ad is attractive enough to entice users to click. Conversely, a low CTR may indicate that the content is not engaging enough.
- Frequency: Shows how many times the average person sees the ad. If the Frequency is too high, users may feel annoyed.
- Quality Score or Relevance Score: Although Facebook doesn’t display it directly, a high CTR and engagement rate are signs that the ad is relevant to the target audience.
Evaluate cost efficiency
- CPC: This is the basic metric for comparing the effectiveness of ad creatives. A low CPC shows that you are attracting clicks at a reasonable cost.
- CPA: This is the most important metric if the goal is conversion. An ad with a cheap CPC but a high CPA is still not an effective ad.
Optimize the campaign based on the report
- If CPC is high and CTR is low: The ad content is not engaging enough, or the audience file is not accurate. Try a new image, a different headline, or narrow/broaden the audience.
- If CTR is high but CPA is high: The ad attracts clicks, but customers are not converting. Recheck the landing page: loading speed, layout, and Call-to-Action (CTA) button.
- If an Ad Group has a low CPC and many conversions, you should increase the budget to seize the opportunity.
- Conversely, an Ad Group with high costs that is not effective: You need to pause or adjust it to avoid waste.
Frequently Asked Questions
You should prioritize Link Clicks, as this metric accurately reflects the number of times users clicked on the link leading to the landing page, which is more important than the total number of Clicks.
This is a sign that the ad is attractive, but the landing page or the purchase process has a problem. It could be due to slow loading speed, a form that is too long, or the message on the landing page not matching the ad.