GA4 has removed many of the built-in reports that were previously available in Universal Analytics, making it difficult for many users to adapt to these changes. However, more and more people are switching to GA4 or have completely switched, because they find it brings new value that UA does not have. One of the notable features of GA4 is the funnel exploration report. If you are in marketing or related to this field, you must have heard about the concept of funnel. To get the most out of the funnel exploration report in GA4, especially when doing overall keyword SEO, you need to understand how to use it. Let’s explore it in detail with Optimal Agency to improve the effectiveness of your strategy!
| ☑️ Qualitiy account 💯, no worries about getting lock | ☑️ Immediate use, unlimited spending |
| ☑️ Best rental price | ☑️ Create campaign freely |
| ☑️ Many offers | ☑️ Optimized ads campaigns |
| ☑️ Consulting fast approved ads | ☑️ Safe, secure, effective and affordable |
| ☑️ Diverse services, accounts | ☑️ 24/7 technical support |
Learn about Funnel Exploration in Google Analytics 4
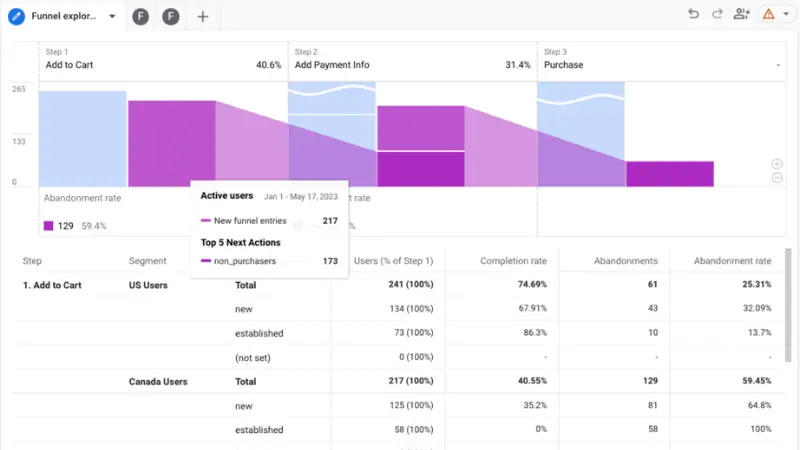
A funnel in marketing is the path that visitors on your website go through to reach a specific target point. This path typically involves visiting different pages and/or taking different actions, such as submitting a form, generating a lead, or completing an e-commerce purchase. Each step in the funnel represents an important stage in the customer journey, from learning about a product to taking the final desired action. The Funnel Explorer report in Google Analytics 4 (GA4) is a powerful tool to help you visualize and analyze this path. It allows you to easily track and see where visitors are dropping out of the funnel, helping you identify bottlenecks in the process.
Analyzing where visitors are dropping out is extremely important. This way, you can pinpoint the steps where customers are most likely to get stuck or stuck. This helps you reduce the number of visitors who abandon each stage and increase your final goal completion rate. Additionally, understanding where visitors drop off allows you to design more effective remarketing campaigns. Marketers can develop different remarketing campaigns based on where a customer drops off. For example, someone who has progressed to the last step in the funnel may be much more interested in your product than someone who has dropped off at the second step. Therefore, remarketing campaigns will need to be tailored to the behavior of each customer group, helping to improve the effectiveness of your marketing efforts.
How to Run Funnel Exploration in Google Analytics 4?
To create and use a custom funnel report in Google Analytics 4 (GA4), you need to understand the steps and how it works. The process begins with creating a funnel exploration technique and saving that exploration data as a funnel report. Here’s a step-by-step guide on how to do this:
Create Funnel Exploration Data
The first step to creating a custom funnel report is to use the funnel exploration technique in GA4. Funnel exploration techniques allow you to set up and configure steps in the user journey on your website, allowing you to track and analyze how users move through different steps to complete specific goals, such as submitting a form, generating a lead, or completing an e-commerce transaction.
Save Funnel Exploration Data as a Report
Once you’ve configured your funnel exploration technique to your liking, you’ll need to save this exploration data as a funnel report. To do this, click the Save as Report button in the Library located in the top right corner of the funnel exploration interface. This will allow GA4 to treat this exploration data as a template or template for creating funnel reports.
The report will be saved to the Report Library
After saving a funnel report, GA4 will save it to the report library. The report library is where all the reports in your property are stored, including default reports and custom reports. In the report library, you can easily add the funnel report to the left navigation panel of the GA4 interface for quick and convenient access in the future.
Note: To create a funnel report and add it to the navigation panel, you need to have high enough access, specifically being an Editor or Administrator in your GA4 account. This permission allows you to make changes and customizations in GA4, including creating and managing funnel reports.
How to Use Funnel Exploration in Google Analytics 4
In the content below, Optimal Agency will share with you how to use Funnel Exploration GA4:

How to Create a Funnel Report in Google Analytics 4
To create a custom funnel report in Google Analytics 4 (GA4), you will follow these detailed steps:
Step 1: Access the explorer
First, log in to your GA4 account and go to the left menu. Here, you will find the Explore icon. Click on this icon to open the explorer, where you can start creating funnel exploration data.
Step 2: Open the funnel exploration data
After entering the explorer, you can choose to open an existing funnel exploration data or create a new one. To learn more about how to configure funnel exploration data, you can refer to specific instructions or Google Analytics help documents.
Step 3: Save the data as a report
Once you have configured the funnel discovery data according to your analysis needs, click the Save as Report button in the Library located in the upper right corner of the interface. Note that this button is only visible to users with Editor or Administrator permissions. If this button is grayed out, it may be because you do not have sufficient access or there are other restrictions. In that case, check the Creation Restrictions to find out why.
Step 4: Enter a name and description for the report
After clicking the save button, you will be asked to enter a name and description for the new funnel report. Entering this information will help you and your team members easily identify and understand the purpose of the report in the future. Make sure that the name and description you provide are clear and descriptive.
Step 5: Save the report
Click the Save button to complete the report creation process. The funnel report you save will include the following settings from the funnel exploration data:
- Filters applied: Filters that were used during analysis will be retained.
- Step definitions: The steps in the funnel are clearly defined to track the user journey.
- Funnel type (open or closed): Funnels can be configured as open or closed, depending on how you want to analyze the user journey.
- Dimension details table: Dimensions used in the report will be retained.
However, advanced edits, such as elapsed time and next action, will not be saved to the report. This means that more detailed adjustments and analysis will not be automatically applied when you create a new report.
How to Add Funnel Reports to Your GA4 Navigation Panel
To easily access and use the funnel reports you’ve created, follow these steps to add them to your Google Analytics 4 navigation panel:
Step 1: Go to the Reports Library
Start by going to your Google Analytics 4 interface. There are two ways to access the reports library where you can add funnel reports:
- Method 1: Under your saved exploration data, you can click the View Reports in the Library option. This option allows you to quickly find your saved funnel reports and take the necessary actions.
- Method 2: On the left menu of your Google Analytics interface, select Reports Library. Here, you’ll see a list of all the reports available on your property.
Step 2: Edit Collection
In the report library, continue with the following steps to add the funnel report to the navigation panel:
- Step 1: In the Collections section, click Edit Collection below the collection where you want to add the report. This collection is where you store the reports that you access frequently or want to reorganize for easy tracking.
- Step 2: In the Drag Reports to Create Collections tab, you will find the funnel report that you saved. Drag the funnel report from the tab on the right and drop it into a suitable topic or location on the left in the navigation panel. This helps you organize the reports in a way that is most convenient for tracking and analysis.
- Step 3: Click Save to confirm adding the funnel report to your collection and navigation panel.
Step 3: Export the Collection
If the collection has not been published, you need to take one final step to ensure that your funnel report is archived and displayed correctly in the navigation panel:
- Step 1: Click the More icon (usually a plus sign) v
- Step 2: Select Publish in the reporting library. This will publish the collection and update your navigation panel with the newly added funnel report.
How to Restore a Funnel Report
If the original discovery data you used to create your funnel report has been deleted, you can still restore your funnel report by recreating the discovery data. Follow these steps to open the report as discovery data:
Step 1: Go to your funnel report
In your funnel report, click the Add comparison option at the top of the report. This option will help you expand or refresh the report to incorporate additional insights.
Step 2: Select Explore Mode
On the right side of the report interface, click Explore. This will open the funnel report as exploration data, allowing you to edit, update, or restore the report according to your analysis needs.
The above steps will help you easily manage and update your funnel reports while ensuring that you can access and use important data effectively.
So, we have shown you how to use Funnel Exploration in Google Analytics 4, as well as how to create user segments for effective remarketing campaigns. In addition, we also have related articles such as how to use Path Exploration in Google Analytics 4. Hopefully, you can apply our instructions to your advertising campaigns successfully.
Please see more:
- How to find Google Ads account ID quickly and accurately
- Learn the steps How to build Link Juice quality
- How to run Performance Max Google Ads correctly
Frequently Asked Questions
Creating Visual Reports in GA4 Funnel Exploration is an effective way to analyze the user journey on your website or app. To do this, you need to open the funnel explorer in GA4 and set up the steps in the user journey that you want to track. Once configured, you can use the visualization options to create visual reports that make it easy to identify drop-off points and better understand user behavior. These reports not only provide a clear view of the steps in the funnel but also help you optimize the user experience and improve the effectiveness of your marketing campaigns.
When using Funnel Exploration in Google Analytics 4, there are a few important notes to remember. First, make sure that you have clearly defined the steps in the funnel to accurately reflect the user journey, as the accuracy of the data depends on the correct configuration. Second, regularly check the filters and conditions applied to ensure that they are not missing important data or causing incorrect segmentation. Additionally, pay attention to analyzing the drop-off points in the funnel to optimize user experience and improve conversion rates. Finally, use these funnel reports to compare campaigns and marketing strategies, make timely adjustments, and improve the effectiveness of your campaigns.